What is a Candlestick Chart?
Candlestick charts were originated in Japan over 100 years before the West had developed the bar charts and point-and-figure charts. In the 1700s, a Japanese man known as Homma discovered that as there was a link between price and the supply and demand of rice, the markets also were strongly influenced by the emotions of traders.
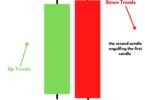
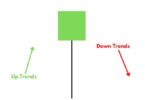
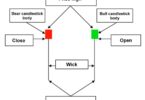
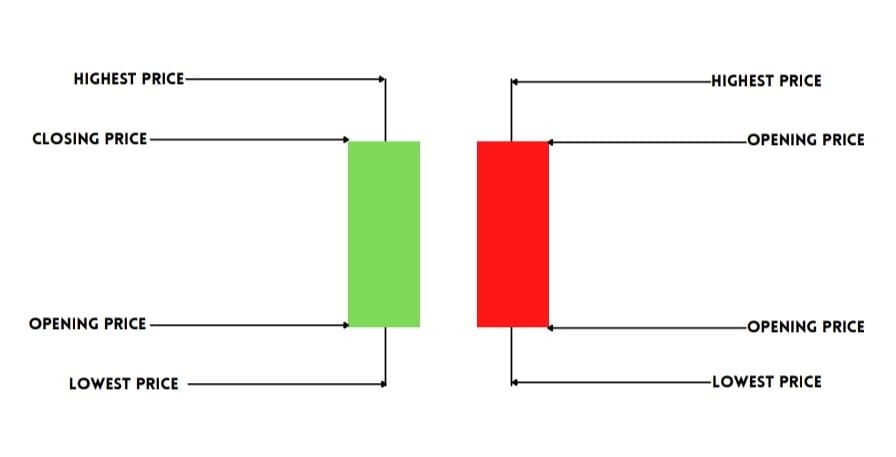
A daily candlestick charts shows the security’s open, high, low, and close price for the day. The candlestick’s wide or rectangle part is called the “real body” which shows the link between opening and closing prices. This real body shows the price range between the open and close of that day’s trading. When the real body is filled, black or red then it means that the close is lower than the open and is known as the bearish candle. It shows that the prices opened, the bears pushed the prices down and closed lower than the opening price. If the real body is empty, white or green then it means that the close was higher than the open known as the bullish candle. It shows that the prices opened, the bulls pushed the prices up and closed higher than the opening price. The thin vertical lines above and below the real body is knowns as the wicks or shadows which represents the high and low prices of the trading session.
What is a Candlestick Chart
The upper shadow shows the high price and lower shadow shows the low prices reached during the trading session.
Before we jump into learning about different candlestick charts, there are few assumptions which need to be kept in mind that are specific to the candlestick charts.
1. Strength is represented by a bullish or green candle and weakness by a bearish or red candle. One should ensure that whenever they are buying it is a green candle day and whenever they are selling, ensure that it’s a red candle day.
2. The textbook definition of a patterns states certain criteria, but one should state that there could be minor variations to the pattern depending on certain market conditions.
3.One should look for a prior trend. If you are looking at a bullish reversal pattern, then the prior trend should be bearish and if you are looking for a bearish reversal pattern then the prior trend should be bullish.
Candlestick Pattern in Hindi
CANDLESTICK MARKET का मूड दर्शाता है, हरा CANDLE का मतलब तेजी और लाल CANDLE मतलब मंदी को दर्शाता है। RECTANGLE PART को बॉडी कहते है और पतली लाइन उसमे से जाती है उसे SHADOW कहते है। SHADOW HIGH और LOW की रेंज को दर्शाता है और बॉडी OPEN और CLOSE को दर्शाता है।
कैंडलस्टिक पैटर्न (Candlestick Patterns) एक चार्ट विश्लेषण तकनीक है जिसका उपयोग विभिन्न वित्तीय विनिमयों में की जाती है, जैसे कि स्टॉक मार्केट और वित्तीय बाजारों में। इसका मुख्य उद्देश्य गहराई से मूल्य चार्ट का विश्लेषण करके मूल्यों के पैटर्न और त्रेंड की समझने में मदद करना है।
कैंडलस्टिक पैटर्न्स चार्ट पर प्रकट होने वाले मुख्य विभिन्न मूल्य स्तरों को दर्शाते हैं, जैसे कि उच्च, निम्न, खुला और बंद। ये पैटर्न्स आमतौर पर शमी की तरह दिखते हैं और विभिन्न नाम और व्याख्याएँ हो सकती हैं जो मूल्यों के चाल को समझने में मदद करती हैं।
कुछ प्रमुख कैंडलस्टिक पैटर्न्स निम्नलिखित हो सकते हैं:
- बुलिश एंगल: यह एक उत्तरदायी पैटर्न है जिसमें एक छोटी गिरावटी कैंडल के बाद एक बड़ी उत्तरदायी कैंडल होती है।
- बीयरिश एंगल: इसमें एक छोटी उत्तरदायी कैंडल के बाद एक बड़ी गिरावटी कैंडल होती है, जिससे मूल्यों में गिरावट का संकेत होता है।
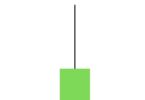
- हैमर: यह एक सिंगल कैंडल पैटर्न है जिसमें एक छोटी गिरावटी कैंडल होती है जिसकी ऊपरी छोटी छोटी शीर्षक होती है।
- शूटिंग स्टार: यह एक ऊपरवाला तंतु गिरावटी कैंडल के बाद एक बड़ी गिरावटी कैंडल होती है, जिससे मूल्यों में उलटी की संभावना होती है।
ये कुछ उदाहरण हैं, लेकिन अन्य भी कई प्रकार के कैंडलस्टिक पैटर्न्स होते हैं जो विभिन्न बाजार संकेतों को दर्शाते हैं। याद रखें कि कैंडलस्टिक पैटर्न्स केवल एक चार्ट विश्लेषण उपकरण होते हैं और विनिवेश निर्णय लेने से पहले अन्य तकनीकों और जानकारियों के साथ मिलाकर उपयोग करने चाहिए।